

Updated: November 13, 2026. Market snapshot: approximately 07:15 UTC. Bitcoin trades continuously, and quoted prices can change rapidly. The technical zones below are analytical references rather than guaranteed levels.
Bitcoin price analysis: BTC slips toward $69,000 as ETF outflows and inflation pressure deepen the selloff
This Bitcoin price analysis begins with a major change since the October update: Bitcoin has not recovered the $80,000 area. Instead, an unsuccessful rebound in early November gave way to renewed selling. By the morning of November 13, 2026, BTC was trading around $69,000–$69,200, based on available spot-market snapshots. CoinGlass reported a 24-hour trading range of approximately $67,449–$73,659 at 07:14 UTC. Those figures describe a particular observation, not a live quotation.
Bitcoin has consequently moved beyond the former $76,500 support and the more recent $73,000–$74,000 trading area. The central question has changed. It is no longer whether $80,000 can hold as support, but whether demand can defend the $67,000–$68,000 region and eventually regain the $70,000–$72,000 band. A sustained recovery would need several confirmations, not simply a brief intraday rebound.
The updated Bitcoin technical analysis indicates a damaged short-term structure, with price trading below important moving-average references. The November 12 daily RSI reading on one perpetual-futures dataset reached 29.5, conventionally considered oversold. That describes the speed of the decline; it is not proof that a bottom has formed. Technical conditions must be assessed alongside closing prices, trading activity and the sustainability of subsequent rebounds.
The Bitcoin fundamental analysis has also deteriorated. U.S. spot Bitcoin ETFs recorded six consecutive sessions of net outflows from November 5 through November 12, totaling approximately $1.486 billion according to the latest Farside Investors data. Meanwhile, the October U.S. CPI report showed another 0.4% monthly increase in headline consumer prices. These figures help explain why institutional participation has not prevented the latest price decline.
Bottom line: the immediate Bitcoin price outlook remains defensive beneath $71,000–$72,000. The $67,000–$68,000 area is a near-term demand test; $64,000–$65,000 becomes a possible lower reference if that region fails. A stronger recovery would require buyers to reclaim $73,000–$74,000, then $75,000–$76,500, before the broader $78,000–$80,000 resistance zone can be reconsidered.
In this article
Bitcoin price analysis — key levels, November 13
- Observed BTC region: about $69,000–$69,200 early on November 13.
- Immediate demand area: approximately $67,000–$68,000.
- Next possible support: approximately $64,000–$65,000 if selling continues.
- First recovery threshold: $70,000–$71,000.
- Short-term resistance: $71,000–$72,000.
- Important overhead zone: $73,000–$74,000.
- Higher resistance: $75,000–$76,500.
- Major recovery region: approximately $78,000–$80,000.
The levels are approximate chart zones, not fixed orders or price predictions. Their importance changes after new daily and weekly closes.
Bitcoin price analysis: what changed between October 30 and November 13?
The defining development is Bitcoin’s failure to sustain its early-November rebound. Following the late-October breakdown below $80,000, Bitcoin briefly recovered that psychological threshold. On November 4, widely followed BTC/USD historical data showed a close near $80,400, reflecting an attempted rebound from the previous decline. That move did not become a durable change in trend.
On November 5, selling returned decisively, taking BTC back toward the mid-$70,000 range. Price then fluctuated around approximately $74,000–$76,000 over several sessions before weakening again. On November 10, the market revisited the low-$73,000 area. By November 12, available daily datasets showed Bitcoin trading near $71,400 at the close. The subsequent November 13 selloff pushed it below $70,000 and briefly into the upper-$67,000 region on the CoinGlass 24-hour range.
In this Bitcoin price analysis, the sequence is important because it combines three negative features: a failed attempt to reclaim broken resistance, progressively lower trading levels, and renewed pressure even after sharp previous losses. A rapid fall can produce technical bounces, but a bounce does not necessarily interrupt the broader sequence of lower highs and lower lows. The Bitcoin price analysis therefore gives more weight to sustained reclaiming of resistance than to single-session percentage gains.
Why has the $80,000 level lost its immediate relevance?
When Bitcoin was trading near $77,000 at the end of October, the $80,000 threshold was the obvious benchmark for a recovery. It remains important, but it is no longer the first price that buyers must challenge. BTC now has several nearer resistance bands overhead, including $70,000–$72,000 and the formerly active $73,000–$74,000 support region.
For Bitcoin price analysis, those levels function like successive tests. A recovery above $70,000 may improve near-term sentiment without changing the wider chart. Reclaiming $73,000–$74,000 would be more meaningful because that area hosted recent trading activity. The higher $75,000–$76,500 region is another test: sustained trading above it would suggest that the market has absorbed an important portion of the recent selling.
Only after those intermediate barriers are cleared does the $78,000–$80,000 zone become a credible recovery objective. Treating $80,000 as the only important threshold would conceal the structure of the present decline. The relevant levels should move as the market moves, rather than remain anchored to an outdated chart.
What would indicate that sellers are losing control?
The first constructive sign in this Bitcoin price analysis would be a price stabilization around the recent lows, with fewer failed rebounds and a reduction in aggressive selling. A second step would be a sustained recovery above $71,000–$72,000. A third would involve holding above $73,000–$74,000 after a retest. Each development would improve the evidence, but none is certain to occur.
It is also useful to distinguish a fast short squeeze from organic demand. A squeeze may deliver a dramatic gain while derivatives positions unwind. Sustainable improvement usually requires spot-market participation, continued buying over multiple sessions and a price structure that holds when immediate excitement fades. That distinction is particularly relevant following a period of pronounced liquidations.
Bitcoin technical analysis: BTC enters a new support zone below $70,000
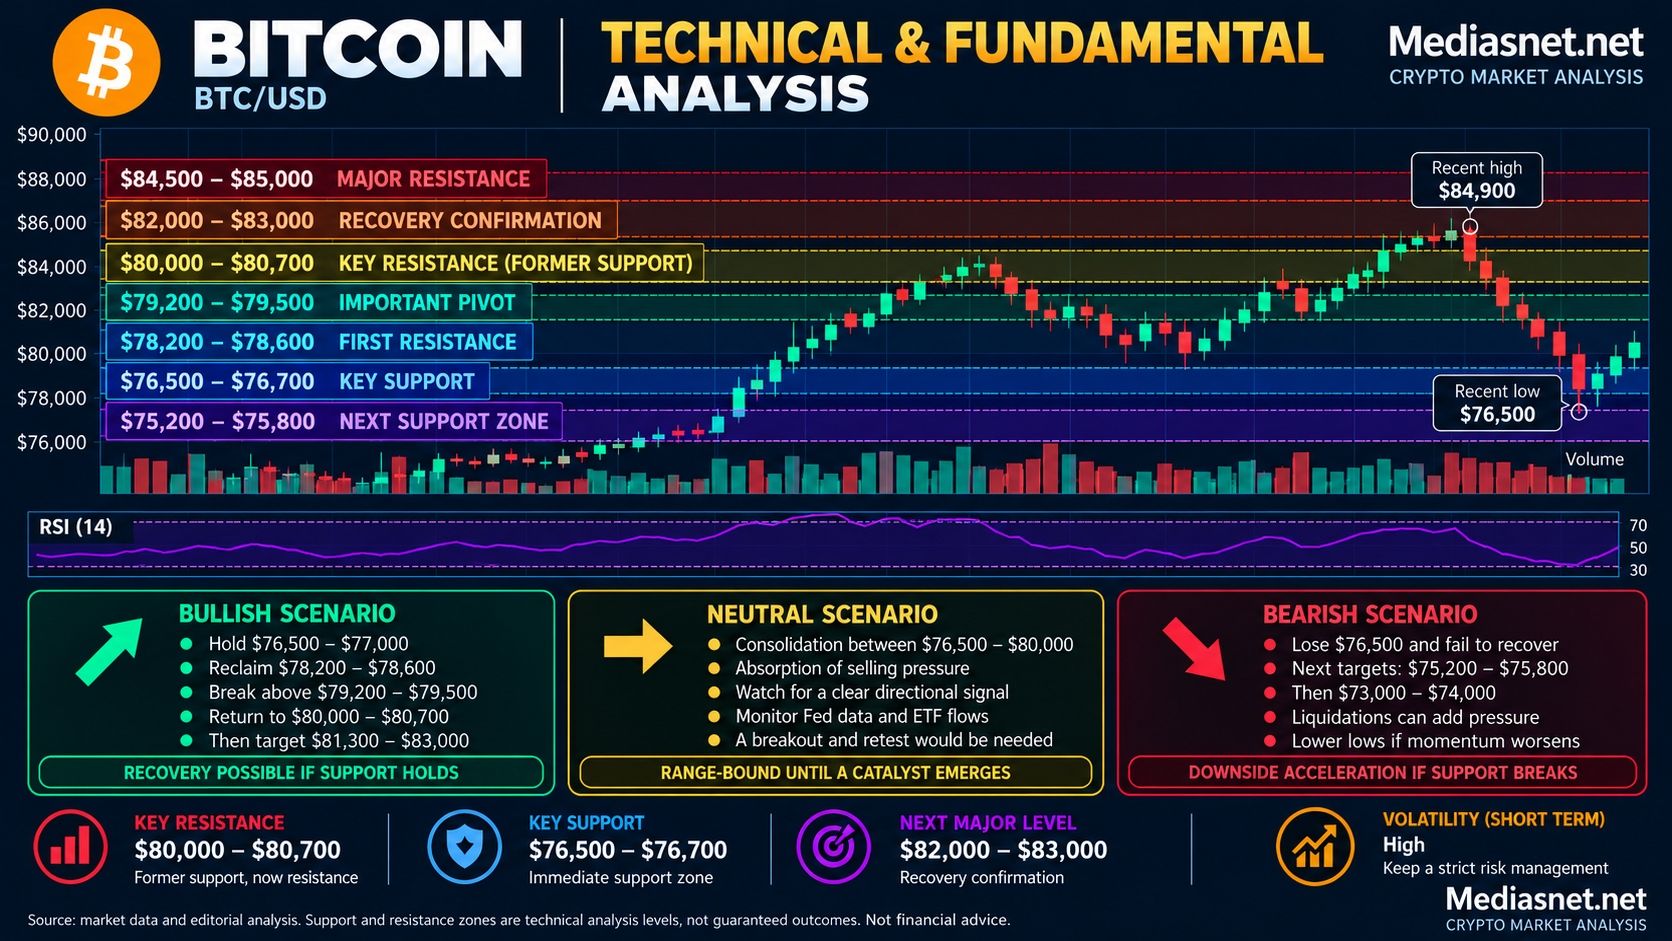
Chart illustration: the current November 13 reference levels are those shown in the updated table below.
The latest Bitcoin technical analysis is characterized by price weakness, deteriorating momentum and important former support levels turning into potential resistance. The key short-term observation is that BTC has moved below the region that contained much of its early-November trading. Prices under $70,000 represent a further deterioration relative to the October 30 snapshot, when BTC was still around $77,000–$78,000.
The current low area in Bitcoin technical analysis is not yet a confirmed support base. CoinGlass recorded a 24-hour low of approximately $67,449 in its November 13 morning snapshot. That provides a measurable recent reference; the broader $67,000–$68,000 zone is an analytical buffer around the observed low, not a separately verified historical demand wall. If the market produces repeated successful tests there, the level may become more significant. If it gives way, attention can move toward $64,000–$65,000 as a conditional lower scenario.
| BTC zone | Current role | What would matter? |
|---|---|---|
| $67,000–$68,000 | Recent low area / immediate test | Repeated defenses could help establish a temporary floor. |
| $64,000–$65,000 | Conditional lower support area | Becomes relevant if the recent low fails on a sustained basis. |
| $70,000–$71,000 | First recovery area | A reclaim would suggest short-term stabilization. |
| $71,000–$72,000 | Immediate overhead resistance | Holding above after a retest would strengthen a rebound. |
| $73,000–$74,000 | Former trading support, now potential resistance | A sustained recovery would weaken the latest bearish impulse. |
| $75,000–$76,500 | Intermediate recovery barrier | Reclaiming this region would improve the broader short-term chart. |
| $78,000–$80,000 | Major overhead resistance | Requires substantial follow-through; not an immediate reversal trigger. |
What do RSI and moving averages show?
The November 12 daily RSI(14) reading published by Keel, based on Hyperliquid perpetual-futures closing prices, was 29.5. On the same dataset, the 20-day moving average stood near $77,314, the 50-day simple moving average near $80,916 and the 200-day simple moving average near $73,112. These figures refer to a specific derivatives dataset and should not be assumed identical across spot exchanges or future updates.
In Bitcoin technical analysis, an RSI below 30 is often called oversold. In practice, that can mean the market has fallen quickly enough to become vulnerable to a rebound. It does not mean that sellers have exhausted their supply, that volatility is over, or that a precise price floor has been identified. In strong downtrends, RSI can remain depressed for longer than expected. It is more useful to ask whether RSI stops making lower lows while price begins to stabilize.
In Bitcoin technical analysis, the position of price below the cited 200-day average adds a longer-horizon warning. Moving averages summarize historical prices, so they are lagging indicators; they can also be crossed temporarily without defining a lasting trend. Nevertheless, when price remains beneath several widely observed averages, buyers face additional potential resistance. A technical recovery must overcome that overhead supply rather than rely solely on an oscillator reading.
Is the MACD confirming the negative trend?
The November 12 Keel dataset also showed a negative daily MACD histogram, with the MACD line below its signal line. This is consistent with weak momentum in that particular market. The important nuance is that MACD can remain bearish even after the price reaches a temporary low because it reacts to earlier price movements. Conversely, the histogram may improve before the price structure decisively reverses.
For this reason, the Bitcoin technical analysis uses MACD and RSI as supporting evidence, not standalone buy or sell signals. The more actionable analytical questions are whether BTC can defend a low, reclaim the first resistance bands and retain those gains into daily closes. Those price-based confirmations help distinguish a temporary reaction from the beginning of a more durable recovery.
Why do daily and weekly closing prices matter?
In Bitcoin technical analysis, Bitcoin trades around the clock, so a brief move through a round-number level can attract attention without changing the balance of supply and demand. A daily close above a reclaimed area is stronger evidence than an isolated wick, though it can still be reversed. A weekly close can provide a broader perspective because it incorporates several sessions of buying and selling instead of one volatile period.
For example, a short-lived return above $71,000 would be encouraging but incomplete. A daily close above $72,000, followed by a successful retest, would provide stronger evidence. If BTC then reached $73,000–$74,000 and rejected that area sharply, the rebound would remain vulnerable. The sequence of observations matters more than a single printed price.
Bitcoin fundamental analysis: ETF redemptions and inflation pressure test demand

The updated Bitcoin fundamental analysis is less supportive than the late-October version. There has not been one single event that explains every price move. Instead, the market is processing a combination of ETF withdrawals, tighter monetary-policy expectations, weaker risk appetite and unwinding leverage. Each factor has different timing, and none should be mistaken for a complete explanation of Bitcoin’s price.
At the end of October, attention focused on a brief sequence of net inflows into U.S. spot Bitcoin ETFs. That signal has been overtaken by a much larger period of net redemptions. At the same time, the Federal Reserve left its policy rate unchanged in October while inflation remained an explicit concern. The subsequent October CPI report showed continued monthly price pressures. For assets whose valuations are sensitive to liquidity and investor risk tolerance, the combination matters.
One important counterpoint for Bitcoin fundamental analysis is that corporate accumulation has not stopped. Strategy disclosed another Bitcoin purchase in its November 9 filing and reported a larger BTC treasury. Yet its corporate demand was far smaller in dollar terms than the recent aggregate ETF withdrawals. Different participants can therefore be buying and selling at the same time, producing a net market outcome that still favors sellers.
For Bitcoin fundamental analysis, longer-term fundamentals should also be separated from short-term demand. The Bitcoin network continues to operate regardless of ETF subscriptions, and its issuance schedule does not change when the market falls. That does not provide an immediate floor: market participants set price based on the supply actually offered for sale and the capital willing to absorb it. A fixed issuance framework and a volatile market price can coexist.
Bitcoin ETF flows: approximately $1.486 billion leaves funds in six sessions
U.S. spot Bitcoin ETF flows turned decisively negative in November. According to Farside Investors, net outflows amounted to $430.2 million on November 5, $411.9 million on November 6, $201.0 million on November 9, $95.0 million on November 10, $299.8 million on November 11 and $47.7 million on November 12. That equals approximately $1,485.6 million across six consecutive trading sessions.
In this Bitcoin price analysis, the November 12 amount is much smaller than several preceding days, but it is still negative in the dataset available for this update. A slowdown in withdrawals should not be confused with net inflows. Similarly, one positive ETF session would not, by itself, undo the cumulative impact of prior redemptions. Both the size and persistence of flows matter for interpreting institutional demand.
| Trading day | Net flows | What it shows |
|---|---|---|
| November 4 | +$74.6M | Temporary net inflow before the streak |
| November 5 | −$430.2M | Large aggregate withdrawals |
| November 6 | −$411.9M | Second heavy redemption day |
| November 9 | −$201.0M | Outflows continue |
| November 10 | −$95.0M | Smaller but still negative |
| November 11 | −$299.8M | Renewed pressure, led by IBIT withdrawals |
| November 12 | −$47.7M | Sixth consecutive negative session |
| Nov. 5–12 total | −$1,485.6M | Net six-session withdrawals |
These totals are compiled from Farside Investors’ U.S. spot Bitcoin ETF flow table. Individual fund reports and aggregate amounts may be revised. This table reports net creation/redemption flows, not the daily investment returns of the funds and not all purchases of Bitcoin globally.
How should ETF withdrawals affect Bitcoin price analysis?
In Bitcoin fundamental analysis, ETF outflows indicate that this particular regulated investment channel is experiencing net redemptions. They can create associated selling pressure depending on fund structure, execution and intermediaries. They do not prove that every institutional investor is selling Bitcoin, nor do they capture trading in futures, direct holdings, foreign products or private investment vehicles.
Importantly, the flow figures are expressed in U.S. dollars and can be affected by the market environment. A severe selloff may lead to withdrawals, rather than withdrawals being the sole cause of a severe selloff. Cause and effect can reinforce each other. For the present Bitcoin fundamental analysis, the priority is to watch for a durable reduction in redemptions and then a return to sustained positive flows.
Does the slowdown on November 12 suggest a bottom?
No firm conclusion follows from one smaller negative figure. November 12’s $47.7 million withdrawal was less severe than November 11’s $299.8 million, but it did not end the streak. A recovery in ETF demand would be more credible if flows turned positive over several sessions while BTC simultaneously stabilized above important chart levels.
It is also worth monitoring whether a recovery is concentrated in one fund or spread across several major products. Broad participation is a more informative demand signal than a small isolated inflow. Even a positive streak cannot guarantee a rising Bitcoin price, because other holders and derivatives participants can still sell heavily. ETF flows are one piece of the market, not the whole market.
Strategy Bitcoin holdings rise to 850,364 BTC
Strategy’s November 9, 2026 SEC filing provides an updated corporate-treasury reference. For the period from November 2 through November 8, the company reported purchasing 1,036 BTC for approximately $81.9 million, at an average acquisition price of approximately $79,012 per BTC, including fees and expenses.
As of November 8, Strategy reported holding 850,364 BTC, acquired for an aggregate price of approximately $64.16 billion. Its reported average purchase price was $75,456 per BTC, including fees and expenses. These are the latest company disclosures used in this update, not a live estimate of holdings after November 8. The figures replace the older October reference of 848,517 BTC.
For Bitcoin fundamental analysis, the purchase illustrates a continuing corporate accumulation strategy. However, it should not be exaggerated into evidence that institutional demand as a whole is strong. Strategy’s approximately $81.9 million purchase during its reported week was small in comparison with the six-session ETF outflow total of approximately $1.486 billion. These are different reporting periods and different kinds of transactions, so the comparison indicates scale rather than a direct net-flow calculation.
Strategy funded the purchases using proceeds from sales of its common stock, according to the filing. Corporate financing decisions, preferred securities, share issuance and treasury management can therefore influence the timing of future purchases. This is different from a simple private investor allocating spare cash to Bitcoin. For investors analyzing BTC, Strategy is relevant as a large known holder, but not as a substitute for examining the broader market.
Does Strategy’s average purchase price create support near $75,456?
No. The company’s average cost is an accounting measure describing its acquisition history. It does not create automatic buy orders in the market, nor does it prevent BTC from trading below that price. During the November 13 morning snapshot, Bitcoin was below Strategy’s reported average acquisition price, demonstrating precisely why a corporate cost basis should not be interpreted as a floor.
Strategy can continue to hold its Bitcoin through price declines, but the behavior of other market participants ultimately determines the clearing price. Its financing obligations and equity-market environment may also influence its strategic options. The prudent interpretation is that the company’s holdings are an important long-term demand reference, with no guarantee about short-term price stabilization.
Official disclosure: Strategy Form 8-K filed November 9, 2026.
Federal Reserve and inflation: why monetary conditions remain a headwind
The Federal Reserve’s October 28 decision left the federal funds target range at 3.75%–4.00%. The decision passed by a 10–2 vote, with Lisa D. Cook and Beth M. Hammack preferring a 25-basis-point increase. The key implication for Bitcoin is that an unchanged policy rate is not necessarily a signal of imminent monetary easing.
For Bitcoin fundamental analysis, the Fed’s statement described economic activity as expanding at a strong pace and inflation as elevated. That combination limits confidence in an immediate shift to a more accommodative policy. Bitcoin is not mechanically linked to the overnight interest rate, but changes in cash yields, borrowing costs and the expected path of monetary policy influence the financial environment in which investors take risk.
For the Bitcoin fundamental analysis, markets’ interpretation of policy can matter as much as the rate decision itself. If investors expected easier conditions and instead revised their outlook toward higher-for-longer rates, risk assets could struggle even without a new increase. Conversely, weaker future inflation data might support risk appetite, although weaker growth could offset that benefit.
What did the October 2026 CPI report actually say?
The U.S. Bureau of Labor Statistics released its October CPI report on November 10, 2026. The seasonally adjusted all-items index increased 0.4% month over month, following a 0.6% increase in September. Core CPI, which excludes food and energy, increased 0.3% month over month. Shelter rose 0.3%, food rose 0.5% and energy rose 0.7% during October.
A particularly important detail is that the BLS did not publish the usual overall 12-month October inflation rate. It explained that October 2025 survey data had not been collected during a lapse in appropriations, leaving missing comparison indexes for most CPI series. Consequently, any confident claim that the official October 2026 headline annual CPI rate was a specific percentage would be misleading. The monthly figures, however, are available and relevant.
The September annual headline CPI reading of 3.7% mentioned in the earlier version of this article is therefore a historical reference, not a valid substitute for a missing October annual reading. October’s monthly inflation figures show continued price pressures, but they cannot automatically be converted into an official one-year rate without the absent baseline data. This distinction is especially important when markets are sensitive to small differences in inflation releases.
Primary documentation: Federal Reserve statement, October 28 and BLS CPI report, November 10.
Could the December Fed meeting change the picture?
Potentially, but future decisions should not be presumed. Markets may change their expectations after new labor, activity and inflation data. A more restrictive tone could sustain pressure on speculative and highly volatile assets. A more accommodating tone might help sentiment, particularly if accompanied by stable economic growth and improving liquidity.
Neither outcome guarantees a particular BTC price. Economic news can have different effects depending on whether the market sees it as confirmation of resilience, evidence of persistent inflation or a warning about growth. The practical approach is to watch both the announced data and how Bitcoin, Treasury yields, the dollar and equity markets actually respond.
Bitcoin, the U.S. dollar and Treasury yields: a liquidity perspective
Bitcoin is a global asset traded in a 24-hour market, but its dollar price remains sensitive to the broader financial environment. Rising U.S. Treasury yields can make interest-bearing alternatives more attractive relative to assets that do not generate contractual cash flows. A strong dollar can also coincide with tighter global financial conditions and pressure on leveraged positions.
These relationships are tendencies, not permanent laws. Bitcoin can rise alongside the dollar when cryptocurrency-specific demand is strong, and it can fall during declining yields if the decline reflects a sudden growth scare. That is why a credible Bitcoin price analysis should avoid treating every macroeconomic movement as a deterministic trading signal.
Liquidity is also broader than the Fed’s headline rate. Financial institutions assess collateral, credit conditions and risk budgets; derivatives traders assess funding costs and margin requirements; ETF investors respond to portfolio-level allocations. A large movement in any one of these areas can temporarily overwhelm a constructive development elsewhere.
The November selloff is consistent with an environment in which investors are less willing to absorb risk. However, the market cannot be reduced to one macro variable. Stronger ETF demand or reduced leverage could help BTC stabilize despite restrictive policy, just as additional redemptions could overpower a favorable individual economic release.
Bitcoin leverage, liquidations and momentum: interpreting the latest volatility
For Bitcoin price analysis, a decline from roughly $74,000 toward $69,000 places pressure on leveraged long positions. When a position reaches its liquidation threshold, an exchange can close it automatically, adding orders to an already falling market. This can make price movements faster than the underlying change in long-term investment demand would suggest.
In its November 13 morning market snapshot, CoinGlass estimated substantial 24-hour futures liquidations, with long positions accounting for most of the reported total. Such estimates depend on exchange coverage and timing, so they should be treated as market observations rather than a complete inventory of all losses. They do, however, reinforce the possibility that forced deleveraging amplified the selloff.
Bitcoin price analysis must account for a feedback loop that liquidations can create. Lower prices trigger forced sales; those sales push prices lower; further positions then become vulnerable. Once enough leverage has been removed, volatility can moderate and a sharp technical rebound becomes possible. Yet the end of a liquidation wave is not synonymous with the return of lasting investment demand.
Can a short squeeze reverse the trend?
Yes, a short squeeze can push Bitcoin higher very quickly. Traders who sell short may have to buy back exposure as prices rise, accelerating the rebound. After a large decline, even a modest improvement in liquidity or sentiment can spark such a move. The result can be visually impressive on an intraday chart.
The difficulty lies in distinguishing forced buying from a genuine shift in underlying demand. If Bitcoin briefly moves above $71,000 but cannot hold $72,000, the market may simply be retracing part of its decline. If it retakes $73,000–$74,000, holds that area and sees ETF withdrawals ease, the evidence becomes more constructive. The difference emerges over time, not from the initial speed of a bounce.
How should open interest and funding be interpreted?
Open interest measures outstanding derivatives exposure, not the amount of bullish capital waiting to purchase spot Bitcoin. Falling open interest during a price drop may indicate positions being closed or liquidated. Rising open interest during a rally can indicate renewed participation, but it does not specify whether that positioning is dominated by buyers or sellers.
Funding rates help show how perpetual-futures positions are balanced, but they are also exchange-specific and volatile. Positive funding means longs generally pay shorts; negative funding reverses that relationship. An extreme reading can indicate crowded positioning, although it is not a reliable standalone timing tool. Combining these indicators with spot volumes, ETF data and closing-price structure provides a more complete assessment.
Bitcoin regulation, institutional access and the Strategic Bitcoin Reserve
In Bitcoin fundamental analysis, regulated investment products remain structurally important despite their current withdrawals. Spot Bitcoin ETFs give investors access to BTC exposure through familiar securities accounts, potentially expanding the range of participants over time. But accessibility does not imply that capital will flow in one direction. The present outflow streak is a reminder that regulated vehicles can facilitate selling as efficiently as buying.
The regulatory environment also influences institutions’ custody decisions, reporting practices and compliance obligations. Clearer rules may reduce uncertainty for some firms while imposing costs on others. In evaluating long-term adoption, it is useful to separate announced policy frameworks from actual transaction volumes, product usage and measurable capital commitments.
The United States has a Strategic Bitcoin Reserve framework, but its existence should not be represented as evidence of continuous government purchases on the open market. Government-controlled BTC obtained through seizures and any prospective new acquisition policies are different categories. A claim about fresh public-sector buying requires specific supporting evidence and should not be inferred simply from the reserve’s name.
For the Bitcoin fundamental analysis, the strongest long-term evidence would be sustained user demand, resilient infrastructure, transparent custody arrangements and measurable new capital allocation. None guarantees price appreciation, and their effects can be overwhelmed temporarily by selling pressure, economic shocks or changes in market liquidity.
Bitcoin price analysis: three scenarios after the break below $70,000
In this Bitcoin price analysis, the following cases are conditional frameworks, not probability-weighted forecasts. They describe what market behavior would strengthen or weaken each interpretation. The relevant levels should be reviewed whenever new daily highs, lows and closes emerge.
Bullish scenario: BTC stabilizes above $67,000–$68,000 and reclaims $73,000
For Bitcoin price analysis, the constructive case begins with buyers defending the recent low region near $67,000–$68,000. Price then needs to return above $70,000 and hold the $71,000–$72,000 band. A more convincing development would follow if BTC regained $73,000–$74,000 and subsequently defended it as support.
Under that sequence, the next potential recovery zone would be $75,000–$76,500, followed by the broader $78,000–$80,000 region. Positive ETF flow sessions, stronger spot participation and easing derivatives stress would add weight to the scenario. Without those confirmations, a rapid rebound might remain merely a technical reaction after an oversold decline.
The bullish case does not require a perfect economic backdrop, but it becomes harder to sustain if yields rise, inflation worries deepen and investors continue withdrawing capital from Bitcoin funds. A healthier scenario would combine improving chart structure with more balanced demand rather than depend on one unusually strong trading day.
Neutral scenario: a volatile range develops between $67,000 and $74,000
Bitcoin price analysis must also consider that Bitcoin may spend time consolidating rather than immediately recovering or breaking down again. A broad $67,000–$74,000 range would allow buyers and sellers to reassess the recent fall, although the width of that range would still imply significant volatility. Repeated failures near the upper boundary and repeated defenses near the lower boundary could characterize this phase.
A neutral range can be constructive if it permits excess leverage to unwind and ETF withdrawals to moderate. It can also become a continuation pattern before another fall. The important evidence would be the direction of a confirmed breakout, the ability to hold the breakout level and whether spot demand supports the move. Until then, assuming a permanent bottom would be premature.
Within this range, individual daily price movements may appear dramatic without resolving the overall direction. For that reason, the Bitcoin technical analysis should continue to distinguish temporary range trading from a restored trend. Investors also need to account for the possibility of false breakouts on both sides.
Bearish scenario: the $67,000 region fails and attention shifts toward $64,000–$65,000
The bearish case in Bitcoin price analysis would strengthen if BTC fell decisively below its latest low region and failed to recover it on a subsequent rebound. A sustained break under approximately $67,000 could shift attention toward a conditional $64,000–$65,000 area. That would be a possible next chart reference, not a guaranteed destination or a verified resting-order cluster.
Further ETF withdrawals, persistent restrictive monetary expectations and renewed forced liquidations could increase the risk of this outcome. The loss of an important support region can also change trader behavior, with previous buyers using subsequent rebounds to reduce exposure rather than add to positions.
Even in a bearish scenario, the path would not necessarily be linear. Short squeezes and sharp countertrend rallies are common during rapid declines. A weekly close below the recent low area would be more meaningful than a brief wick. Conversely, a fast recovery back above broken support could invalidate part of the immediate downside setup.
What to watch in the next Bitcoin price analysis
$67,000–$68,000: does the market defend the newly observed low region or establish lower lows?
$70,000–$72,000: can BTC reclaim and hold the first recovery band?
$73,000–$74,000: can a former trading area become support again?
$75,000–$76,500: does a rebound recover a significant portion of November’s decline?
Spot Bitcoin ETFs: do aggregate withdrawals slow, stop or reverse over several sessions?
Inflation and the Fed: do new releases shift expectations for the next monetary-policy decision?
Corporate holdings: does Strategy report new purchases in its next official filing?
Momentum and leverage: do RSI, MACD and derivatives positioning show stabilization alongside price?
Bitcoin price analysis FAQ
What does the latest Bitcoin price analysis show?
The November 13 update shows Bitcoin trading near $69,000 in the morning snapshot after another sharp decline. Short-term price structure remains weak, ETF funds have recorded sustained withdrawals, and the $67,000–$68,000 region has become the immediate downside reference. A convincing recovery requires more than a one-day rebound.
What is Bitcoin’s immediate support?
The recent low around $67,449, reported in a November 13 CoinGlass snapshot, makes the broader $67,000–$68,000 region important to monitor. This is an analytical area around an observed low, not a guarantee that buyers will defend it. If sustained trading develops below that region, $64,000–$65,000 is a possible lower scenario.
Where is the first Bitcoin resistance?
The first recovery band is around $70,000–$72,000. A sustained break above it would be an initial improvement, while $73,000–$74,000 is the next more meaningful overhead area. The higher $75,000–$76,500 region would need to be reclaimed before a move toward $78,000–$80,000 becomes more credible.
Is Bitcoin oversold according to technical analysis?
A November 12 daily RSI reading of 29.5 in a published perpetual-futures dataset meets the common oversold definition. That condition can precede a bounce but does not identify a precise bottom. Price confirmation, improving market participation and successful retests are more useful than an isolated oscillator threshold.
Are U.S. spot Bitcoin ETFs recording inflows or outflows?
They recorded six consecutive net outflow sessions from November 5 through November 12, totaling about $1.486 billion in the Farside dataset. The latest reported November 12 figure was negative $47.7 million. Fund data may be revised, so newer sessions should be checked before making a subsequent market assessment.
How much Bitcoin does Strategy hold?
In its November 9 filing, Strategy reported 850,364 BTC as of November 8, 2026, following the purchase of 1,036 BTC during the preceding reported week. Its aggregate acquisition cost was approximately $64.16 billion, with an average cost of $75,456 per BTC, including fees and expenses.
Does Strategy’s average purchase price protect the market?
No. An average acquisition cost describes what one company paid historically; it does not create a minimum market price. Bitcoin can trade above or below that reference depending on buying and selling from all participants. The company’s financing and holding strategy cannot be assumed to prevent a further decline.
Did the Federal Reserve raise interest rates in October?
No. On October 28, 2026, the Federal Reserve maintained its target range at 3.75%–4.00%. The decision passed 10–2, with two policymakers preferring a quarter-point increase. The unchanged rate did not remove inflation concerns or guarantee easier financial conditions.
What was the October 2026 U.S. inflation rate?
Headline CPI rose 0.4% month over month and core CPI rose 0.3%, according to the BLS report published November 10. The BLS did not publish the usual official October year-over-year headline rate because October 2025 reference data were unavailable for most CPI indexes. Monthly and annual rates must not be confused.
Could Bitcoin recover to $80,000?
It could, but a return to $80,000 would require overcoming several intermediate resistance zones. The first steps would be sustained trading above $70,000–$72,000 and $73,000–$74,000. The $75,000–$76,500 area would then become relevant. A move toward $78,000–$80,000 remains conditional rather than assured.
Could BTC fall below $67,000?
Yes. A sustained break below the observed November 13 low region would weaken the chart further and make a test of the conditional $64,000–$65,000 area more plausible. That is an analytical scenario, not a forecast with a guaranteed target or time frame. Market prices can also recover sharply after temporary breaks.
What is the difference between Bitcoin technical analysis and Bitcoin fundamental analysis?
Bitcoin technical analysis studies price, volume, trend structure, support, resistance and momentum indicators such as RSI or MACD. Bitcoin fundamental analysis studies the economic and institutional environment, including ETF demand, monetary policy, corporate holdings, regulation and network characteristics. Combining both can reveal why a technically weak market may still have long-term adoption potential, or why good structural news may not immediately lift prices.
Which Bitcoin indicator matters most right now?
In Bitcoin technical analysis, there is no single definitive indicator. The most immediate observations are whether BTC defends the $67,000–$68,000 region, whether it reclaims nearby resistance, and whether institutional fund withdrawals ease. RSI helps describe momentum, but price structure and sustained demand provide a more complete picture. The weighting of these indicators can change with market conditions.
Final Bitcoin price analysis: the immediate battle moves below $70,000
This updated Bitcoin price analysis reflects a significantly weaker market than the October 30 version. Bitcoin briefly revisited the $80,000 area in early November but failed to sustain the rebound. By November 13, morning spot data placed BTC near $69,000, with a recent intraday low in the upper-$67,000 region. The earlier $76,500–$77,000 reference can no longer be described as the market’s immediate support.
The Bitcoin technical analysis now focuses on defending approximately $67,000–$68,000, reclaiming $70,000–$72,000 and then challenging $73,000–$74,000. The $75,000–$76,500 area is the next important resistance on a stronger rebound. A return toward $78,000–$80,000 would represent a more substantial recovery, but the market must first overcome the nearer obstacles.
The Bitcoin fundamental analysis adds another layer of caution. U.S. spot Bitcoin ETFs suffered about $1.486 billion in aggregate net withdrawals across six consecutive sessions ending November 12. October CPI increased 0.4% from the preceding month, while the Fed continued to hold its benchmark target range at 3.75%–4.00%. Neither development suggests that financial conditions are automatically turning supportive for speculative assets.
At the same time, institutional and corporate behavior is not uniform. Strategy disclosed a new purchase and reported 850,364 BTC as of November 8. That accumulation is a meaningful corporate datapoint, but it is neither sufficient to offset every other source of selling nor a reason to assume a guaranteed floor near the company’s average cost.
The short-term view remains bearish until price demonstrates sustained recovery through nearby resistance. A successful defense of the recent lows could permit a rebound; a breakdown would shift attention toward lower conditional zones. The highest-quality signal would combine improving price action, easing ETF redemptions and more stable market leverage. In an environment of elevated volatility, confirmed developments matter more than confident price predictions.
Sources, methodology and further reading
Price observations are snapshots and can differ between exchanges, data vendors and trading pairs. The approximate November 13 spot reference and 24-hour range come from CoinGlass market data. Technical moving averages and RSI are observations from a November 12 derivatives dataset; the support and resistance zones are our conditional interpretation, not guaranteed exchange order levels.
Institutional, corporate and macro figures are sourced from Farside Investors ETF flows, Strategy’s November 9 SEC filing, the Federal Reserve’s October 28 decision and the BLS October CPI report. Later releases may supersede these figures.
For continuing coverage, read Latest Crypto News. For developments in decentralized lending, trading and blockchain finance, visit DeFi News on MediasNet.
This Bitcoin price analysis is informational market commentary, not personalized investment advice. Bitcoin and leveraged instruments can experience rapid losses. Technical levels and market data should always be checked again before acting.
Further reading:

How to invest in crypto: practical guide


Thortrading brings together two cryptocurrency traders with around five years of active market experience. Their work focuses on Bitcoin, altcoins, DeFi and crypto market trends, with an approach based on technical analysis, market cycles and risk management. Through their articles, they aim to help readers better understand both the opportunities and risks of crypto trading
2 thoughts on “Bitcoin price analysis 2026”
Comments are closed.