
Bitcoin Price Analysis 2026: Technical and Fundamental Outlook
Updated on July 1, 2026
Bitcoin is once again trading in a highly sensitive zone after losing the important $60,000 level. At the time of this update, BTC is trading around $58,500–$59,000, after moving between roughly $57,900 and $59,300 during the latest session.
This Bitcoin price analysis aims to provide a complete market view by combining price action, support and resistance levels, RSI, market structure, ETF flows, Strategy-related concerns and broader macroeconomic conditions.
If you follow crypto and DeFi news, you already know that Bitcoin remains the key asset driving sentiment across the entire digital asset market. When BTC weakens, the broader market often struggles. When BTC regains momentum, confidence tends to return across crypto.
The key question is now simple: is Bitcoin building a deeper accumulation zone near $58,000, or is the market preparing for another leg lower toward $56,000, $55,000 or even $52,000?
Bitcoin Price Analysis Snapshot
- Current market zone: around $58,500–$59,000
- Immediate support: $58,000–$58,500
- Major support: $56,000–$58,000
- Stress zone: $52,000–$55,000
- Extreme correction zone: $48,000–$52,000
- First resistance: $60,000–$60,500
- Intermediate resistance: $62,000–$63,500
- Key bullish reclaim zone: $65,000–$66,500
- Main confirmation area: $67,000–$68,000
- Major bullish confirmation: $70,000–$72,000
Bitcoin Technical Analysis: BTC Is Testing the $58,000 Support Area
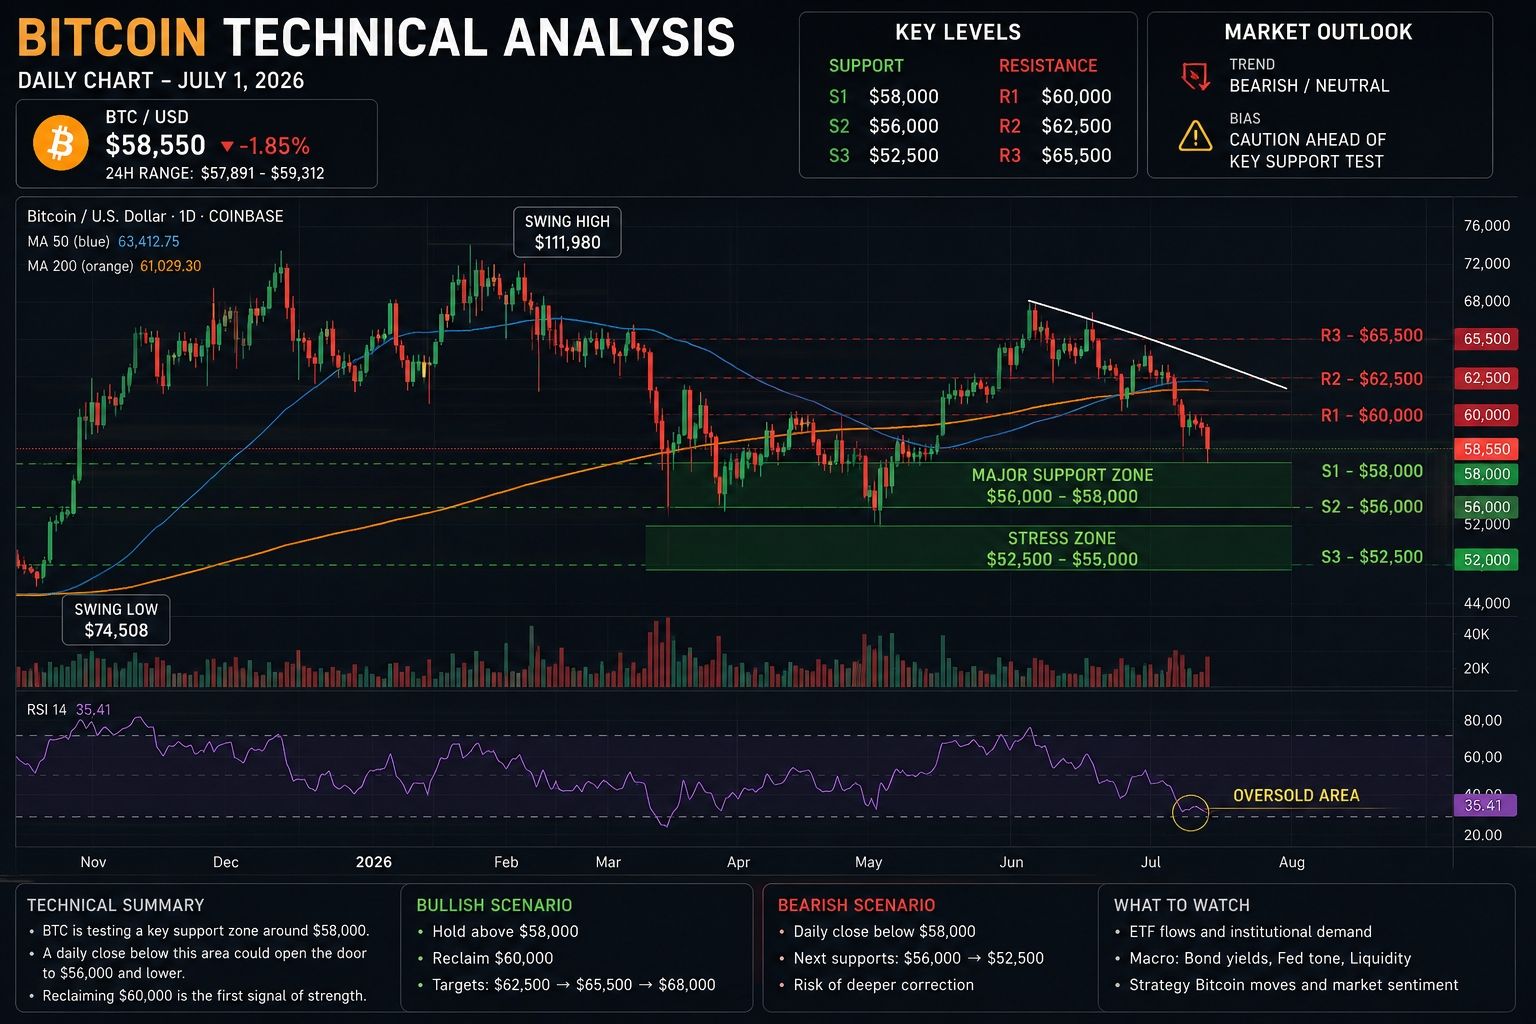
In this Bitcoin technical analysis, the market structure has weakened again compared with the previous version of the article. Bitcoin was previously trying to stabilize around the $62,000–$63,000 area. It is now trading closer to $58,500, which means that buyers are being tested near one of the most important support zones of the current correction.
This Bitcoin price analysis shows that BTC remains trapped between two opposing forces. On one side, the $58,000 area is still a major short-term support where buyers may try to defend the broader cycle structure. On the other side, Bitcoin has failed to reclaim $60,000, which has now become the first important resistance level.
The first level to watch is now the $58,000–$58,500 support zone. If buyers defend this area, Bitcoin could attempt a rebound toward $60,000–$60,500, then $62,000–$63,500. However, that would only be an initial recovery. A much stronger bullish shift would require BTC to reclaim the $65,000–$66,500 zone, followed by the $67,000–$68,000 confirmation area.
As long as Bitcoin remains below these resistance levels, the short-term structure stays fragile. A move above $60,000 would reduce immediate pressure, but the real technical shift would come only with a broader reclaim of $62,000–$63,500, then $65,000–$66,500 and finally $67,000–$68,000.
Key Bitcoin Support and Resistance Levels
| Level | Zone | Meaning |
|---|---|---|
| Immediate support | $58,000–$58,500 | First area buyers must defend |
| Major support | $56,000–$58,000 | Important technical zone if $58,000 breaks |
| Stress zone | $52,000–$55,000 | High-stress area if selling accelerates |
| Extreme correction zone | $48,000–$52,000 | Area that could appear if ETF outflows and macro pressure worsen |
| First resistance | $60,000–$60,500 | First area BTC must reclaim to reduce immediate pressure |
| Intermediate resistance | $62,000–$63,500 | Important zone to rebuild short-term momentum |
| Key reclaim zone | $65,000–$66,500 | Main level to validate a more constructive rebound |
| Bullish confirmation | $67,000–$68,000 | Stronger signal that buyers are regaining control |
| Major confirmation | $70,000–$72,000 | Level needed to restore a much healthier bullish structure |
In this Bitcoin price analysis, the current levels show that BTC is sitting in a decision zone, somewhere between a potential long-term accumulation area and a possible continuation of the broader correction.
For now, BTC needs to defend the $58,000–$58,500 area. If this zone holds, a technical rebound remains possible. But if Bitcoin loses this support with strong volume, the next downside target could quickly become $56,000–$58,000, followed by the $52,000–$55,000 region.
Technical Indicators: Momentum Remains Fragile
Bitcoin’s technical indicators are no longer in a clean bullish configuration. The market has lost momentum after failing to hold above $60,000, and traders are now watching whether the $58,000 region can hold.
- RSI: the RSI remains weak and reflects a market still dominated by caution rather than aggressive accumulation;
- Moving averages: BTC is struggling below important short-term levels, and a reclaim of moving averages would be needed to improve the chart;
- Volume: buying activity near $58,000 is visible, but stronger volume is needed above $60,000, $62,000 and $65,000;
- Liquidations: leverage continues to amplify short-term moves in both directions;
- ETF flows: institutional demand remains important structurally, but recent outflows and weaker appetite have reduced bullish momentum;
- Sentiment: the market remains cautious after several weeks of pressure, especially as altcoins continue to underperform BTC.
This is why Bitcoin remains difficult to trade in the short term. A simple bounce from support is not enough. Traders still need confirmation above resistance before assuming that the correction is over.
Bitcoin Price Analysis 2026: Three Possible Scenarios
1. Bullish Scenario: Bitcoin Reclaims $60,000, Then $65,000
The bullish scenario would start with a clean recovery above $60,000–$60,500. This would show that buyers are defending the $58,000 area and that immediate selling pressure is beginning to slow.
However, the most important confirmation would come only if Bitcoin reclaims the $62,000–$63,500 area, then the $65,000–$66,500 zone. Above that, the next key challenge would remain the $67,000–$68,000 level, followed by the $70,000–$72,000 confirmation area.
If BTC breaks above these levels with stronger volume, traders could then watch the following targets:
- First bullish target: $60,000–$60,500
- Second bullish target: $62,000–$63,500
- Key reclaim zone: $65,000–$66,500
- Confirmation zone: $67,000–$68,000
- Major confirmation zone: $70,000–$72,000
- Extension if momentum returns: $75,000–$78,000
In this scenario, Bitcoin price analysis would suggest that buyers are absorbing the correction and that the market is rebuilding a more constructive structure.
2. Neutral Scenario: Bitcoin Consolidates Between $56,000 and $63,500
The neutral scenario would be a sideways market between $56,000 and $63,500. Bitcoin could spend several days or weeks in this range while investors wait for clearer signals from ETF flows, macroeconomic conditions, bond yields and broader crypto market sentiment.
This would not necessarily be bearish. Consolidation phases are common after sharp corrections. However, as long as Bitcoin remains below $62,000–$63,500, and especially below $65,000–$66,500, the market would remain vulnerable to another wave of selling.
In this scenario, patience becomes essential. A rebound alone would not be enough. The market would still need confirmation through a reclaim of major resistance zones.
3. Bearish Scenario: Bitcoin Loses the $58,000 Area
The bearish scenario would gain strength if Bitcoin clearly loses the $58,000–$58,500 support zone. In that case, the market could move lower to test deeper liquidity zones.
- First bearish target: $56,000–$58,000
- Second bearish target: $52,000–$55,000
- Extreme correction zone: $48,000–$52,000
From a Bitcoin price analysis perspective, a decline toward these levels would not automatically mean the end of the long-term Bitcoin cycle. But it would confirm that the short-term market remains fragile.
Key technical view: Bitcoin needs to defend the $58,000–$58,500 zone and then reclaim $60,000–$60,500 first. A stronger bullish shift would require a move back above $62,000–$63,500, then $65,000–$66,500 and finally $67,000–$68,000.
Bitcoin Fundamental Analysis: Are the Long-Term Drivers Still Strong?

A complete Bitcoin fundamental analysis must separate two different things: short-term market stress and long-term structural adoption. Bitcoin can remain fundamentally strong while still experiencing sharp corrections.
This Bitcoin price analysis is not only about support and resistance. It is also about understanding whether the long-term thesis remains intact while short-term conditions stay fragile.
1. Bitcoin ETF Flows Still Matter
Spot Bitcoin ETFs remain one of the most important structural drivers of the market. They have made BTC more accessible to traditional investors and have reinforced Bitcoin’s role inside conventional investment portfolios.
However, the short-term picture has weakened during the recent correction. ETF outflows and subdued institutional flows have reduced bullish momentum and contributed to a more cautious tone across the market. Recent reports also show that major banks are becoming more cautious on Bitcoin forecasts because ETF flows have turned negative.
That does not invalidate the long-term thesis, but it does show that institutional demand is not always one-way.
In a balanced Bitcoin price analysis, ETF flows should be viewed as a market thermometer. Strong inflows can support price action. Persistent outflows can increase short-term pressure.
2. Global Liquidity, the Fed and Bond Yields Remain Central
A solid Bitcoin fundamental analysis must also focus on the macro environment. Bitcoin tends to perform better when liquidity conditions improve, risk appetite returns and markets begin to expect a more supportive monetary backdrop.
Right now, that backdrop is still mixed. The Federal Reserve, bond yields, inflation expectations and the strength of the U.S. dollar remain important variables. As long as macro conditions remain uncertain, rebounds in Bitcoin may stay fragile.
The bond market deserves special attention. Rising long-term yields, heavy public debt, large fiscal deficits and weak demand for government bonds can tighten financial conditions even without an immediate central bank rate hike. This is why some investors now speak about a possible bond-market crisis rather than a simple rate-cycle problem.
For Bitcoin, the message is nuanced. In theory, distrust in sovereign debt can strengthen the long-term hard-money narrative. In practice, a sudden spike in yields can hurt risk assets, reduce liquidity and force investors to sell volatile positions first. This means Bitcoin can benefit from the long-term narrative while still suffering in the short term if bond-market stress accelerates.
This is a critical point in any Bitcoin price analysis: long-term fundamentals may remain healthy, but short-term price action can still suffer if liquidity does not turn clearly supportive.
3. Strategy and the Bitcoin Treasury Trade: From Bullish Engine to Risk Factor
Another factor now worth including in a serious Bitcoin fundamental analysis is Strategy, formerly known as MicroStrategy. The company remains one of the largest corporate holders of Bitcoin and has become a symbol of the institutional Bitcoin treasury trade.
For years, Strategy was seen mostly as a bullish force for BTC. The company accumulated Bitcoin aggressively, used capital markets to finance its strategy and became a leveraged proxy for Bitcoin exposure.
But this model also creates risks when market conditions deteriorate.
The concern is not simply that Strategy owns a large amount of BTC. The concern is the financing structure around that position. Higher borrowing costs, preferred stock pressure, convertible debt, equity dilution concerns and slower Bitcoin purchases can all reduce the bullish impact of Strategy’s accumulation model.
The market is now paying closer attention to a major shift: Strategy has opened the door to selling Bitcoin under its capital plan. This does not mean the company is abandoning Bitcoin, but it does change the perception of the treasury model. Investors can no longer assume that corporate Bitcoin holders will only buy and never sell.
If Strategy can no longer raise capital easily, its ability to buy large amounts of BTC may slow. If investors become worried about its capital structure, MSTR volatility could rise. And if the market begins to question whether the Bitcoin treasury model is sustainable during a prolonged correction, sentiment around BTC could be affected.
This does not mean Strategy is about to collapse, nor does it mean Bitcoin’s long-term thesis is broken. But it does mean that investors should no longer treat corporate Bitcoin accumulation as a one-way bullish factor. In 2026, Strategy has become both a symbol of institutional conviction and a potential source of short-term market stress.
4. Stablecoin Liquidity Is Potential Fuel, Not Automatic Demand
Another important point in Bitcoin fundamental analysis is stablecoin liquidity. Stablecoins represent potential buying power inside the crypto ecosystem. When investors hold large amounts of stablecoins, capital can rotate quickly back into Bitcoin if confidence returns.
However, potential liquidity is not the same as real demand. Stablecoins sitting on the sidelines do not automatically push Bitcoin higher. What matters is whether this capital actually rotates back into BTC and other risk assets.
In the current market, stablecoin liquidity remains important, but it is not enough on its own. Bitcoin still needs confirmed demand, not just idle capital.
5. Bitcoin’s Scarcity Remains Intact
Bitcoin’s supply schedule remains one of its strongest long-term fundamentals. BTC has a fixed maximum supply of 21 million coins, and new issuance continues to decline over time through the halving mechanism.
This scarcity does not prevent volatility. Bitcoin can still fall sharply during periods of leverage, fear, ETF outflows, Strategy-related concerns or macro stress. But scarcity remains one of the core reasons why long-term investors continue to view BTC as a unique asset.
From a Bitcoin price analysis perspective, scarcity is a long-term argument, not a short-term timing tool. It supports the investment thesis, but it does not eliminate the need for risk management.
6. Institutional Adoption Goes Beyond ETFs
Institutional adoption of Bitcoin is no longer limited to ETFs. Public companies, treasury strategies, asset managers, fintech platforms and financial institutions continue to integrate Bitcoin into different investment frameworks.
This does not mean Bitcoin will rise in a straight line. Institutional investors can also reduce exposure during risk-off periods. But the broader trend remains important: Bitcoin is now far more integrated into traditional finance than in previous cycles.
In a balanced Bitcoin price analysis 2026, investors should separate short-term volatility from long-term adoption. Short-term price action is driven by leverage, ETF flows, liquidity, bond yields, Strategy-related concerns and market psychology. Long-term value is more closely linked to scarcity, network security, adoption and trust in the Bitcoin protocol.
Editors’ View: Attractive for Long-Term Investors, Risky for Short and Medium Term
Our view: the current Bitcoin price zone may become interesting again for long-term investors, especially for those who want to build exposure gradually over time.
The goal of this Bitcoin price analysis is not to call a perfect bottom. It is to help readers understand why the current area may offer long-term opportunity while still remaining dangerous for short-term positioning.
At around $58,500, Bitcoin is now much closer to an important support region than it was in mid-June. For investors who believe in Bitcoin’s long-term scarcity, institutional adoption and strategic role within the crypto market, this type of correction can become an accumulation zone.
But there is an important warning: an attractive long-term price does not mean short-term risk has disappeared. Bitcoin can still fall further if the $58,000–$58,500 support area breaks. In that case, the market could quickly move toward $56,000–$58,000, then $52,000–$55,000, or even lower in a broader stress scenario.
The situation is even more delicate because several risk factors are now overlapping: weaker momentum, uneven ETF flows, concerns around Strategy’s financing model, possible Bitcoin sales under treasury plans and rising bond-market stress. None of these factors invalidate Bitcoin’s long-term thesis, but together they make the short-term setup more unstable.
Editors’ conclusion: attractive for long-term investors using a gradual approach, but still risky for short- and medium-term traders. Patience and risk management remain essential.
Bitcoin Investment Strategies: Long-Term Investor vs Active Trader
Long-Term Investor Approach
For long-term investors, the current correction may create opportunities, but only with a progressive strategy. Bitcoin is volatile, and entering the market with all available capital at one single level is rarely prudent.
- Current observation zone: $58,000–$59,500
- More attractive accumulation zone: $56,000–$58,000
- Deep value zone if correction accelerates: $52,000–$55,000
- Extreme stress zone: $48,000–$52,000
- Investment horizon: 2 to 5 years
This approach is based on a cyclical view of Bitcoin, not on a short-term prediction. Long-term investors may prefer gradual accumulation instead of trying to identify the exact bottom.
However, even long-term investors should remain cautious. If Bitcoin loses the $58,000 support zone with strong volume, the probability of a deeper correction would increase.
Active Trading Approach
For active traders, the current zone is risky. Bitcoin is trading near important support after a failed rebound, where false breakouts, sudden liquidations and volatility spikes are common.
- possible entries only after confirmed rebounds near support;
- high caution if BTC remains below $60,000–$60,500;
- cleaner bullish signal above $62,000–$63,500;
- stronger confirmation above $65,000–$66,500;
- major bullish confirmation above $67,000–$68,000 and then $70,000–$72,000;
- strict risk management and stop-loss levels remain essential.
The current market can trap both buyers and sellers. This is why patience may be more valuable than trying to catch every short-term move.
Bitcoin Forecast 2026–2027
Bitcoin forecasts remain highly uncertain because the market depends on ETF flows, global liquidity, central bank policy, bond yields, institutional risk appetite, Strategy-related sentiment and the broader crypto cycle.
Bearish Scenario
Target zone: $48,000–$55,000
This scenario would become more credible if Bitcoin loses the $58,000 support area, ETF outflows continue, Strategy-related concerns intensify and macroeconomic conditions remain unfavorable.
A move toward this area would not necessarily mean the end of the Bitcoin cycle, but it would confirm a deeper correction and a more defensive market structure.
Base Case Scenario
Target zone: $60,000–$72,000
This scenario assumes that Bitcoin stabilizes above the current support area, ETF flows improve gradually and macro conditions become less restrictive.
In this case, BTC could first reclaim $60,000–$60,500, then retest $62,000–$63,500. A confirmed breakout above the next resistance zones could reopen the path toward $65,000–$66,500, then $67,000–$68,000 and finally $70,000–$72,000.
Bullish Scenario
Target zone: $82,000–$120,000+
This scenario would require stronger ETF inflows, renewed risk appetite, improving liquidity conditions and a clear breakout above major resistance levels.
For this bullish scenario to become credible, Bitcoin would need to move back above $75,000–$78,000 with strong volume and confirm that institutional demand is returning in a sustainable way. A return above $80,000 would be an important psychological signal, while a move toward $100,000 would require a much healthier macro and liquidity backdrop.
Bitcoin in 2026: Main Strengths and Risks
Main Strengths
- Bitcoin remains the most institutionalized crypto asset;
- supply is limited to 21 million coins;
- BTC remains the central asset of the crypto market;
- ETF adoption has increased access for traditional investors;
- Bitcoin benefits from strong global recognition and deep liquidity;
- bond-market distrust can strengthen Bitcoin’s long-term hard-money narrative;
- Bitcoin’s network security and scarcity remain intact despite short-term volatility.
Main Risks
- high short-term volatility;
- dependence on ETF flows and institutional sentiment;
- sensitivity to interest rates, bond yields and the U.S. dollar;
- rising concern around sovereign debt and bond-market instability;
- Strategy-related pressure if financing conditions become less favorable;
- possible BTC sales by corporate treasury vehicles under stress;
- regulatory uncertainty;
- violent liquidations during periods of excessive leverage;
- risk of a deeper correction if the $58,000 support zone fails.
Final View: Bitcoin Fundamentals Remain Strong, But Confirmation Is Still Missing
The long-term Bitcoin thesis remains intact. Scarcity, network security, institutional adoption and global recognition continue to support Bitcoin’s role as a unique financial asset.
However, this Bitcoin price analysis also shows that short-term conditions remain fragile. BTC is trying to stabilize near a critical support area, ETF flows have become more uneven, Strategy-related concerns are now part of the discussion, and bond-market stress is becoming harder to ignore.
In summary, this Bitcoin price analysis shows that Bitcoin may be attractive again for long-term investors, but it remains vulnerable in the short and medium term until key resistance zones are reclaimed.
For now, the most important signal is confirmation. If Bitcoin holds the $58,000–$58,500 area and reclaims $60,000–$60,500, the recovery scenario becomes more credible. If BTC then moves above $62,000–$63,500 and later above $65,000–$66,500, buyers could regain stronger control.
On the other hand, if Bitcoin loses the $58,000 zone with strong volume, the risk of a deeper correction toward $56,000–$58,000 and then $52,000–$55,000 would increase.
Overall, this Bitcoin price analysis shows a market in transition. Bitcoin is not fundamentally broken, but the technical structure still requires confirmation before a new bullish phase can be trusted.
FAQ: Bitcoin Price Analysis 2026
Can Bitcoin recover in 2026?
Yes, Bitcoin can still recover in 2026. However, a strong recovery would require BTC to reclaim the $60,000–$60,500 area first, then the more important $62,000–$63,500 and $65,000–$66,500 resistance zones. A move above $67,000–$68,000 and then $70,000–$72,000 would provide stronger bullish confirmation.
Can Bitcoin still fall further?
Yes. If BTC loses the $58,000–$58,500 support zone, a correction toward $56,000–$58,000 or even $52,000–$55,000 remains possible. In a more stressful scenario, Bitcoin could retest lower liquidity zones near $48,000–$52,000.
Is now a good time to buy Bitcoin?
For long-term investors, the current area may be interesting only with a gradual strategy. For short-term traders, the market remains risky until Bitcoin clearly reclaims $60,000–$60,500 and then the higher resistance zones.
Why is Bitcoin price analysis important?
A Bitcoin price analysis helps investors go beyond the simple BTC price. It combines support and resistance levels, RSI, momentum, ETF flows, liquidity conditions, bond yields, Strategy-related risks and macroeconomic factors to better understand both short-term risk and long-term opportunity.
What price could Bitcoin reach in 2026 or 2027?
If macro conditions improve and ETF inflows return, Bitcoin could retest the $75,000–$82,000 area and potentially move higher. In a more bullish scenario, a return toward $100,000–$120,000 remains possible. In a bearish scenario, BTC could revisit $55,000, $52,000 or even lower.
What is the difference between Bitcoin technical analysis and Bitcoin fundamental analysis?
Bitcoin technical analysis focuses on charts, price action, support, resistance, RSI, volume and market structure. Bitcoin fundamental analysis focuses on liquidity, ETF flows, interest rates, macro conditions, bond yields, Strategy-related risks, adoption, scarcity and long-term demand.
Why does Strategy matter for Bitcoin?
Strategy matters because it is one of the largest corporate Bitcoin holders and has become a symbol of the Bitcoin treasury strategy. When market conditions are favorable, its accumulation can support sentiment. But when financing costs rise or investors question its capital structure, Strategy can also become a source of short-term market stress.
Can a bond-market crisis hurt Bitcoin?
Yes, at least in the short term. A bond-market crisis could strengthen Bitcoin’s long-term narrative as a scarce asset outside the traditional sovereign debt system. But in the short term, rising yields and tighter liquidity can hurt risk assets, including Bitcoin.
Why are ETF flows important for Bitcoin?
ETF flows are important because spot Bitcoin ETFs have become one of the main institutional gateways into BTC. Strong inflows can support demand and improve sentiment. Persistent outflows can increase selling pressure and weaken short-term momentum.
This article is not financial advice. This Bitcoin price analysis is for educational purposes only and should be used to help readers form their own opinion. Bitcoin remains a volatile asset, and you should never invest more than you can afford to lose.
Want to go further? You can also read our guide on how to invest in crypto in 2026.
Thortrading brings together two cryptocurrency traders with around five years of active market experience. Their work focuses on Bitcoin, altcoins, DeFi and crypto market trends, with an approach based on technical analysis, market cycles and risk management. Through their articles, they aim to help readers better understand both the opportunities and risks of crypto trading
2 thoughts on “Bitcoin price analysis 2026”
Comments are closed.